
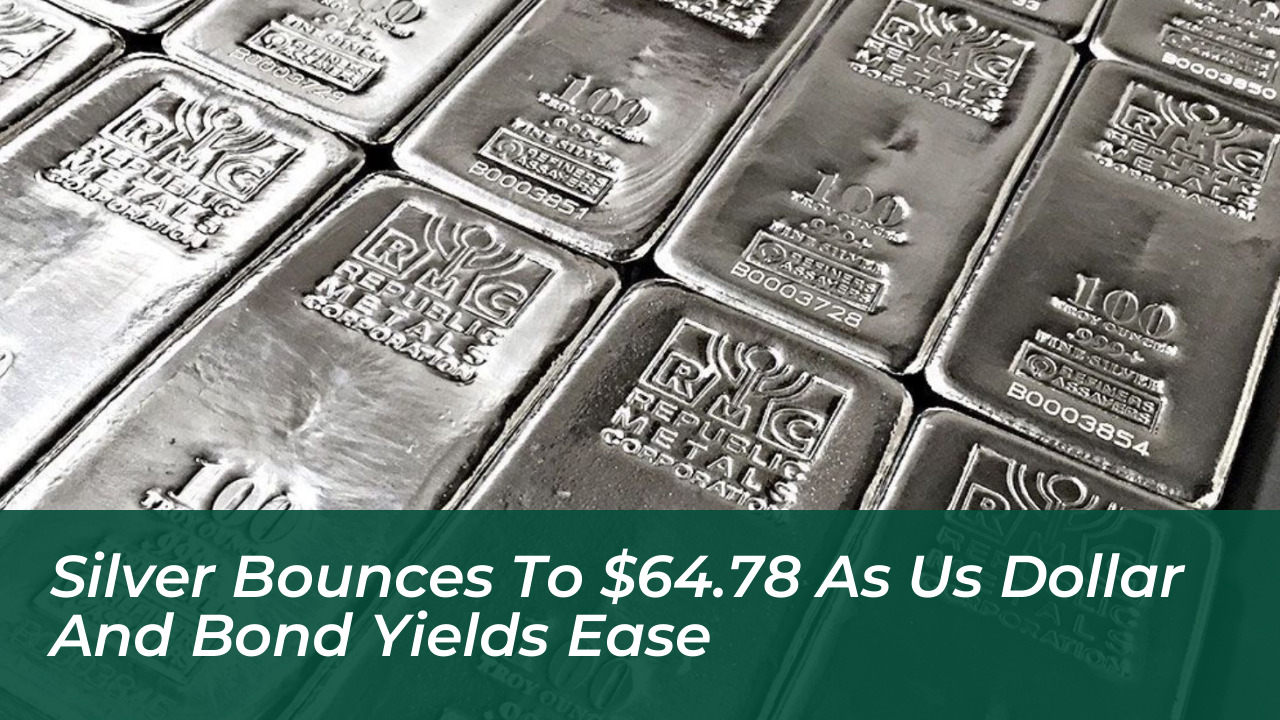
Spot silver staged a notable recovery, bouncing to $64.78 per ounce on September 25, 2026. This aggressive upward move reversed earlier losses that had pressured the white metal. A temporary pullback in United States Treasury yields and a softer greenback provided immediate relief to precious metals across the board. The market had retreated to an intraday low of $63.07 before buyers stepped in with substantial volume.
- Understanding the Silver Market Rebound to .78
- Macroeconomic Catalysts Behind the Silver Rally
- The Correction in United States Treasury Yields
- The US Dollar Index Retreat
- Technical Analysis and Critical Price Levels
- Support Zones and Defense Lines
- Resistance Hurdles for Bullish Momentum
- Industrial Demand and Physical Market Dynamics
- Gold-to-Silver Ratio Implications and Investor Sentiment
- Frequently Asked Questions
- What caused silver to bounce to .78 on September 25, 2026?
- What technical support levels protected silver from deeper losses?
- How do Treasury yields impact silver prices?
- What role does industrial demand play in the silver market?
Understanding the Silver Market Rebound to $64.78
The sudden reversal caught many market participants off guard after days of persistent selling pressure. Algorithmic trading desks reacted swiftly to moving average tests, triggering a wave of short covering that pushed prices higher during the mid-session trading hours. This swift recovery demonstrates the high beta nature of the precious metals complex when external macroeconomic conditions shift unexpectedly.
Macroeconomic shifts in global currency and debt markets provided the immediate relief needed for this turnaround. When fixed income markets stabilize, speculative capital often returns to commodities with high liquidity profiles. Institutional portfolios recalibrated their exposure as debt yields retreated from multi-year peaks, creating a window of opportunity for bullish traders to re-enter the market.
Significance of institutional and algorithmic trading behavior around moving averages cannot be understated. Automated programs govern a vast share of daily volume in exchange-traded contracts. When price action approaches established technical thresholds, programmed buy orders execute rapidly, amplifying standard market movements and producing sharp intraday rebounds.
Macroeconomic Catalysts Behind the Silver Rally
The recovery in silver prices did not occur in a vacuum. It coincided directly with macroeconomic shifts in currency and debt markets. Understanding these drivers explains why precious metals caught a sudden bid after days of downward pressure.
The Correction in United States Treasury Yields
Benchmark 10-year Treasury yields corrected downward to 5.15 percent. This easing followed extreme spikes to 19-year highs recorded earlier in the trading week. High real yields historically impose a heavy penalty on non-yielding assets like silver and gold. When yields pause their ascent or pull back, the opportunity cost of holding precious metals drops instantly.
This reduction in holding costs served as the primary triggering mechanism for short-covering and fresh long positions among institutional funds. Portfolio managers who had maintained bearish bets quickly unwound their positions to lock in profits, fueling the upward trajectory of the spot price.
The US Dollar Index Retreat
Simultaneously, the US Dollar Index (DXY) eased to 101.05. Because silver is priced globally in dollars, an inverse correlation governs the relationship between the greenback and bullion. A weaker dollar makes silver more affordable for international buyers holding other currencies.
This expanded purchasing power revitalized global demand, injecting fresh momentum into physical and derivative markets alike. As foreign buyers stepped up their acquisition rates, domestic traders found validation to push prices further away from the daily lows.
Technical Analysis and Critical Price Levels
Traders monitoring the $64.78 bounce are closely evaluating chart structures to determine whether this movement is a sustainable breakout or a temporary relief rally before the next downward leg.
Support Zones and Defense Lines
The intraday low of $63.07 served as the immediate baseline support during the morning sell-off. Buyers defended this level aggressively, preventing a more severe liquidation cascade. This floor established a clear risk management parameter for intraday speculators.
Meanwhile, the 50-day moving average held firm at $63.78, reinforcing the bullish technical structure. Beneath that metric, the critical $62.98 threshold stands as the ultimate barrier preventing a broader technical breakdown toward lower historical demand clusters.
Resistance Hurdles for Bullish Momentum
Psychological resistance at the $65.00 threshold remains the first major obstacle for the current recovery phase. Sellers have historically clustered limit orders around round-number milestones, creating a natural ceiling for short-term rallies.
Secondary selling pressure is expected near the $66.00 mark. If market participants manage to clear that barrier, broader upside targets approach the August high zone near $70.00, opening the door for more aggressive long-term accumulation strategies.
Industrial Demand and Physical Market Dynamics
While macroeconomic data drives daily sentiment, the structural floor for silver rests on its unique position as both a monetary metal and an indispensable industrial input. Photovoltaic manufacturing, electronics, and medical applications consume vast quantities of annual supply.
However, industrial demand faces crosscurrents from shifting import dynamics and export tax rebate adjustments in China. These policy changes altered front-loading behaviors among solar manufacturers, leading to intermittent destocking phases that occasionally disrupt spot price stability.
At the same time, the influence of import duties and foreign exchange reserve management in India continues to alter regional physical absorption rates. Local retail buyers frequently adjust their purchasing volume based on rupee fluctuations and domestic tax policies, creating a secondary layer of supply and demand friction.
Gold-to-Silver Ratio Implications and Investor Sentiment
The price action in silver also influences the gold-to-silver ratio. As silver outperforms during aggressive recovery phases, the ratio compresses from elevated historical averages, signaling a shift in relative value preferences among commodities traders.
Central bank accumulation programs typically drive capital toward gold during risk-out or risk-off events, establishing gold as the premier monetary safe haven. However, silver possesses a higher liquidity and volatility profile, which results in accelerated percentage moves during general market recoveries.
When industrial demand aligns with monetary safe-haven flows, silver exhibits explosive catch-up rallies that outpace gold. Investors monitoring this dynamic utilize the gold-to-silver ratio to time their sector rotations effectively.
Frequently Asked Questions
What caused silver to bounce to $64.78 on September 25, 2026?
Silver rebounded due to a temporary retreat in United States Treasury yields and a slight drop in the US Dollar Index to 101.05, which relieved pressure on non-yielding precious metals.
What technical support levels protected silver from deeper losses?
Silver found firm technical support near its 50-day moving average of $63.78 and the critical $62.98 price level after hitting a daily low of $63.07.
How do Treasury yields impact silver prices?
Rising Treasury yields increase the opportunity cost of holding non-yielding assets like silver, often depressing prices. Conversely, a pullback in yields makes precious metals more attractive to investors.
What role does industrial demand play in the silver market?
Industrial applications, particularly solar photovoltaic manufacturing and electronics, account for a massive share of physical silver consumption, directly influencing long-term supply and demand balances alongside monetary investment flows.